


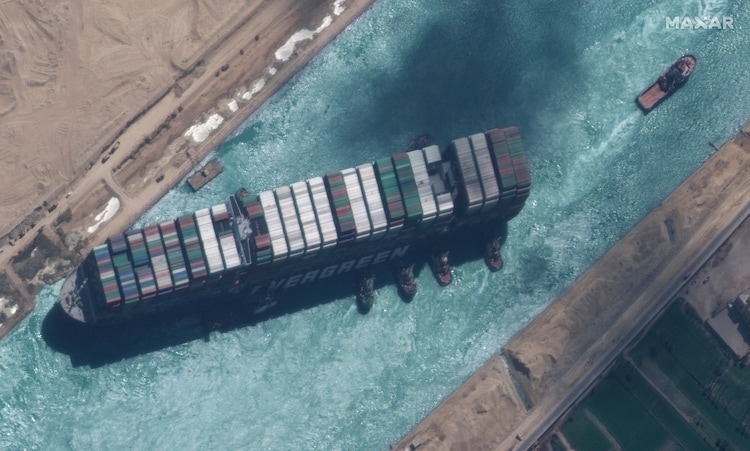
Around three years ago, in March 2021, one of the largest container ships ever built sent the world into a tizzy after it got stuck in the Suez Canal, one of the busiest shipping lanes.
While social media was abuzz comparing the spectacle to the Titanic incident, the incident was nothing short of a nightmare for global shipping and trade.
The Ever Given, nearly twice the size of the Titanic, got stuck in the narrowest part of the Suez Canal for six days, holding up more than 400 vessels and nearly $60 billion of trade.
If six days of the Suez Canal blockage wiped out $60 billion, imagine the amount if the disruption extended to over two months.
HOW HOUTHI ATTACKS HAVE DISRUPTED SUEZ CANAL SHIPPING ROUTE
A similar situation is in play as the flow of commercial goods through the Suez Canal has again been disrupted after Iran-backed Houthi rebels started attacking merchant vessels in the Red Sea since November 15.
The Houthis, based in Yemen, have said the attacks were in response to Israel’s bombardment in Palestine’s Gaza Strip. Since October 7, Israel has been locked in a war with Hamas after the Palestinian militant group crossed over and launched a surprise ground offensive.
Fearing attacks by the Houthis on the Suez Canal route, which connects Asia and Western countries, shipping firms have been forced to take a longer alternate route around the Cape of Good Hope at the southern tip of Africa.
The Cape of Good Hope used to be the primary shipping route before 1869. It lost its prominence after the Suez Canal was opened jointly by the French and the Ottoman Empire, which reduced travel time between Asia and Europe.
Cut to the present, about 19,000 ships, carrying around $1 trillion worth of goods, navigate the Suez Canal every year, making it one of the world’s key trade routes, as per The Guardian.
Overall, about 12 per cent of global trade and 10 per cent of the maritime fuel trade passes through the Red Sea.
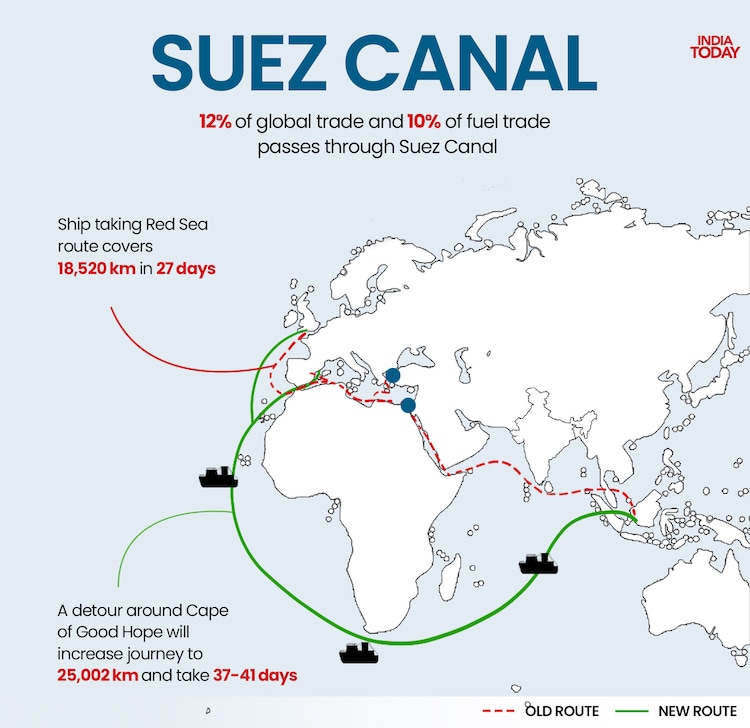
In an ideal situation, if a vessel departs from a port in China, it will take around 27 days to cover 18,520 km (10,000 nautical miles) and reach Northern Europe.
However, with ships now being forced to take the Cape of Good Hope route, which entails circumnavigating the entire African continent, it is now taking them 37–41 days to reach their destination. (As shown in the map above)
Thus, ships have to cover 25,002 km, around an additional 6,000 km, for their journey around the Cape of Good Hope.
The development has increased freight rates by around 20-30 per cent. This is so because each merchant vessel taking the alternate route is incurring an extra expense of around $1.25 million per sailing between Asia and Europe.
PANAMA CANAL DROUGHT ADDS TO WOES
However, the woes do not end there. Another important shipping route through the Panama Canal, which connects the Atlantic and Pacific Oceans, is also facing a blockage due to drought-like conditions.
The drought, due to low rainfall, has left the canal’s water levels at their lowest in decades, forcing Panama to let fewer ships sail through it.
To put the situation in perspective, the passage of one merchant vessel is estimated to consume as much water as half a million Panamanians use in one day.
As per a report in The Economist, shipping via the Panama Canal, which accounts for 6 per cent of global trade, has dropped by around 30 per cent, leading to more wait time for arrival of shipments.
On average, about 35 to 40 ships transit the canal each day. Around $270 billion worth of cargo passes along the canal each year en route to over 170 countries.
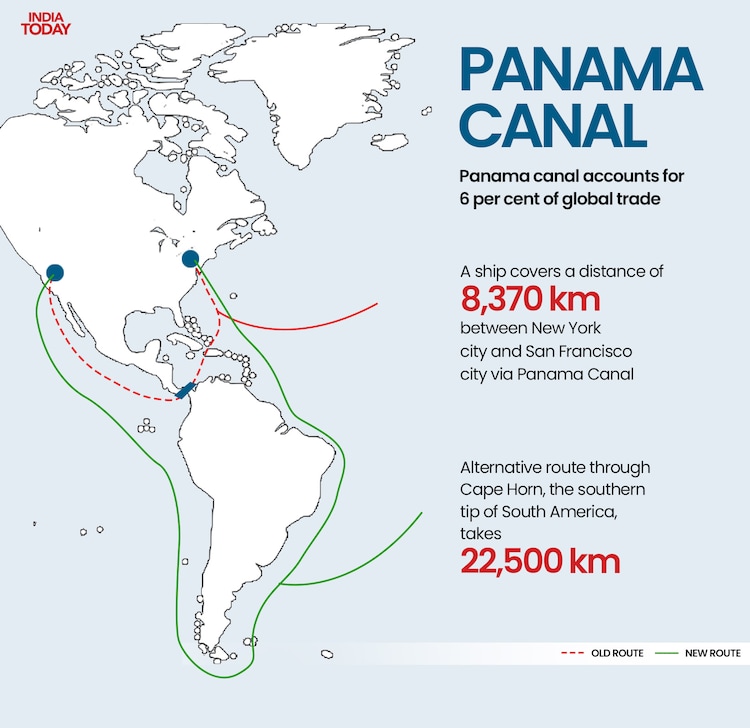
For example, as shown in the map above, a ship covers a distance of 8,370 km between New York City and San Francisco city via the Panama Canal. An alternative route involves passing through Cape Horn, the southern tip of South America, covering more than double the distance of 22,500 km.
A vessel taking the Cape Horn route, instead of the Panama Canal, takes 18 additional days of travel time.
With two crucial trade routes facing disruptions, over a third of global trade is under threat, raising concerns about driving up inflation.


